集群监控仪表盘
系统简介
AIP EDA Exporter是针对AIP或LSF集群,基于Prometheus监控系统的集群负载采集器。 Prometheus通过它执行AIP命令行定期获取AIP的主机和作业统计数据,这些数据可以通过Grafana实现可视化。
AIP EDA Exporter的数据流和架构见下图:
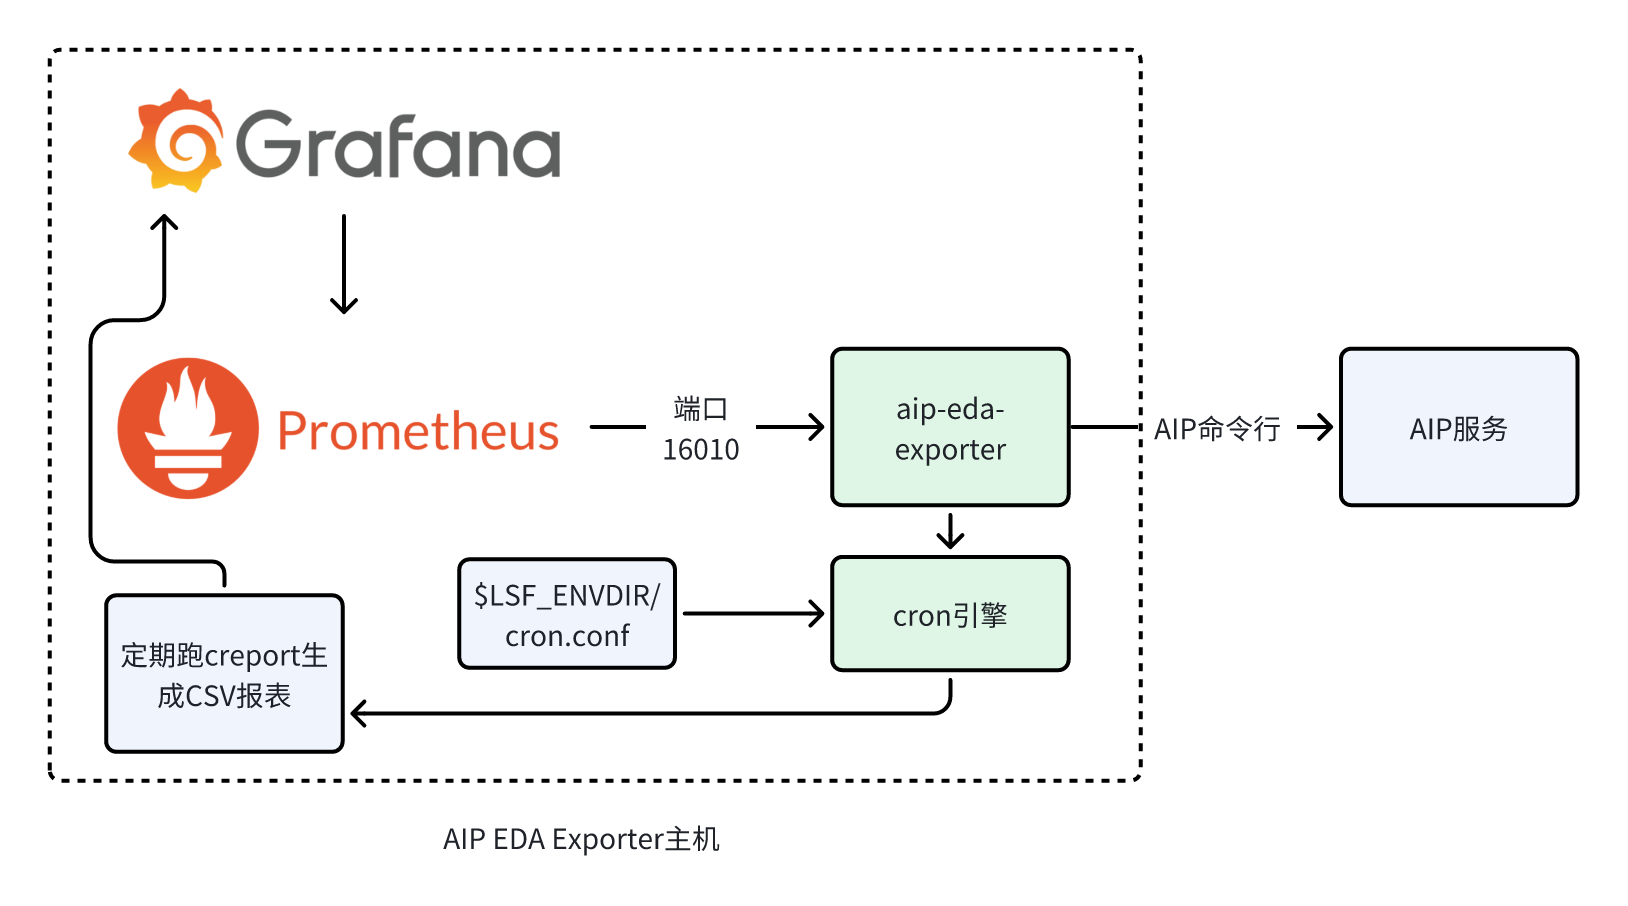
Prometheus配置定期调用aip-eda-exporter的接口获取AIP的数据,存放在自己的数据库里。Grafana里的可视化定期从Prometheus抽取数据显示。
安装前的准备
AIP EDA Exporter部署的主机可以是AIP的前三台有key的Master候选主机中的任意一台。高可用见后面的介绍。 AIP EDA Exporter会定期从/opt/skyformai/etc读取AIP的可以文件,如果key文件无效,服务自动退出。
LSF支持的版本是:LSF 10.1.0.0或LSF 10.1.0.7或更高(暂不支持LSF 10.1.0.1 - LSF 10.1.0.6)。
主机上需要安装python3和python requests (pip3 install requests)
安装Prometheus和Grafana
从https://prometheus.io/download/下载最新版的Prometheus包,如prometheus-3.3.1.linux-amd64.tar.gz。
解压后把可执行文件prometheus放到/usr/lib/prometheus目录下。
tar xfz prometheus-3.3.1.linux-amd64.tar.gz
mkdir -p /usr/lib/prometheus
cp prometheus-3.3.1.linux-amd64/prometheus /usr/lib/prometheus
从https://grafana.com/grafana/download下载最新版的Grafana RPM包,如grafana-enterprise-10.3.3-1.x86_64.rpm
安装RPM并允许服务自动启动。
yum localinstall -y grafana-enterprise-10.3.3-1.x86_64.rpm
systemctl enable grafana-server
安装
在AIP解压后的子目录prometheus-aip-exporter下运行install脚本。
cd prometheus-aip-exporter
./install
安装脚本自动完成以下的动作:
在/etc/grafana/provisioning/dashboards中设置仪表盘,这些仪表盘不能在Grafana中直接修改。
安装并启动aip-eda-exporter服务,该服务在10610端口上为Prometheus提供数据,数据通过调用AIP命令获得。
配置(/usr/lib/prometheus/prometheus.yml)并启动prometheus服务。
配置(/etc/grafana/grafana.ini)并启动grafana服务。
安装后的检查:
确保所有的服务正常运行,等到30秒后,运行:
systemctl status prometheus grafana-server aip-eda-exporter
利用Linux systemd查看服务日志最后部分:journalctl -x -e -u 服务名,例子:
journalctl -x -e -u aip-eda-exporter
配置
aip-eda-exporter
缺省不需要配置文件。没有配置文件时不输出运行作业的资源使用。如果需要运行作业的资源使用, 可以在$LSF_ENVDIR (如:/opt/skyformai/etc或/opt/lsf/conf) 里生成aip-export.yaml。里面增加:
max_run_jobs: -1  #  打开运行作业的指标监控
cluster: aip      #  集群名。这个参数用于对所有指标增加cluster的标签,
                  #  用于多个集群共用一个Prometheus的场景
master_only: yes  #  只有在集群master上才输出数据。非master作为备用exporter
use_estream: y    #  指明作业监控数据使用cbsched的estream
max_run_jobs的可选值为:
0:禁止运行作业的每个作业的指标监控
正整数:当系统中运行作业数小于这个值时,启用运行作业的每个作业指标监控
-1:启用运行作业的每个作业指标监控
小技巧
cbsched的estream参考(参考 cb.yaml ) 里的estream_interval。
Prometheus
Prometheus的配置文件为/usr/lib/prometheus/prometheus.yml。与aip-eda-exporter有关的配置为:
- job_name: "aip_eda_exporter"
  scrape_interval: 30s
  scrape_timeout: 30s
  static_configs:
  - targets: ["localhost:16010"]
如果需要接入已有的Prometheus,可以把以上这段插入到已有的scrape_configs里,并把targets里的locahost改到aip-eda-exporter运行的主机名或IP地址。
备注
缺省每30秒Prometheus采集一次数据,如果数据量太大,可以把这个参数调大一些。如果配置了许可证监控, exporter采集许可证服务器数据时会对许可证服务器有小些负载,最好把缺省的30秒改成60秒。
缺省Prometheus保存15天的数据,如果需要保留更长的时间(需要更大的存储空间,性能也会变差), 修改/lib/systemd/system/prometheus.service里的ExecStart(例子中增加到60天):
ExecStart=/usr/lib/prometheus/prometheus --storage.tsdb.retention.time=60d
Grafana
Grafana的配置文件为/etc/grafana/grafana.ini。配的图表:/etc/grafana/provisioning/dashboards目录下的.json文件。 修改这些文件后需要重启服务:
systemctl restart grafana-server
修改底色为浅色,修改/etc/grafana/grafana.ini里:
default_theme = light
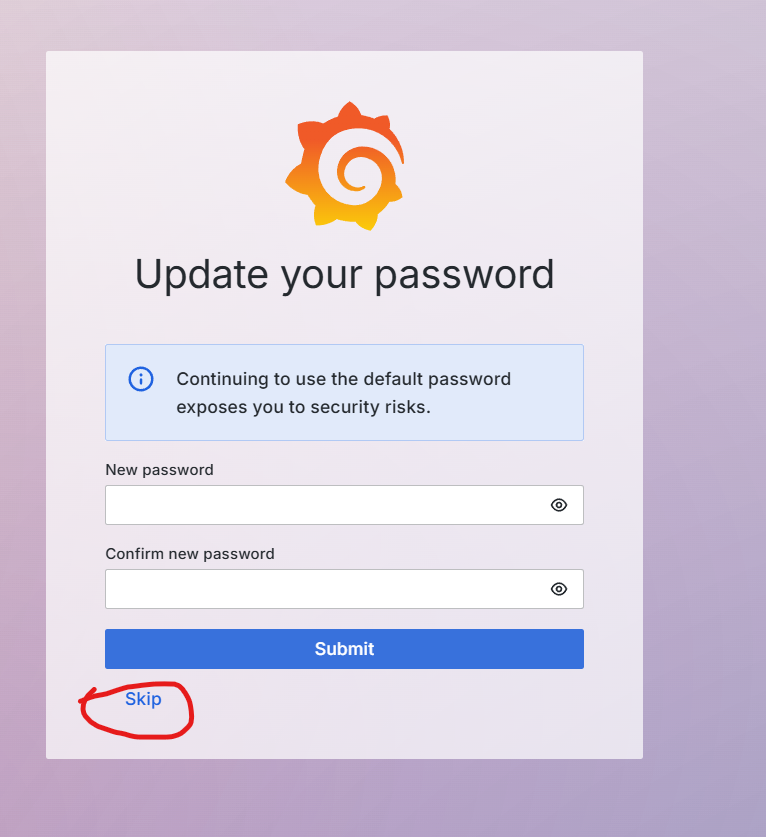
界面改为中文 点击右上角的“Sign in”,用户名:admin,密码:admin。如果不修改admin密码,选择下方的skip。
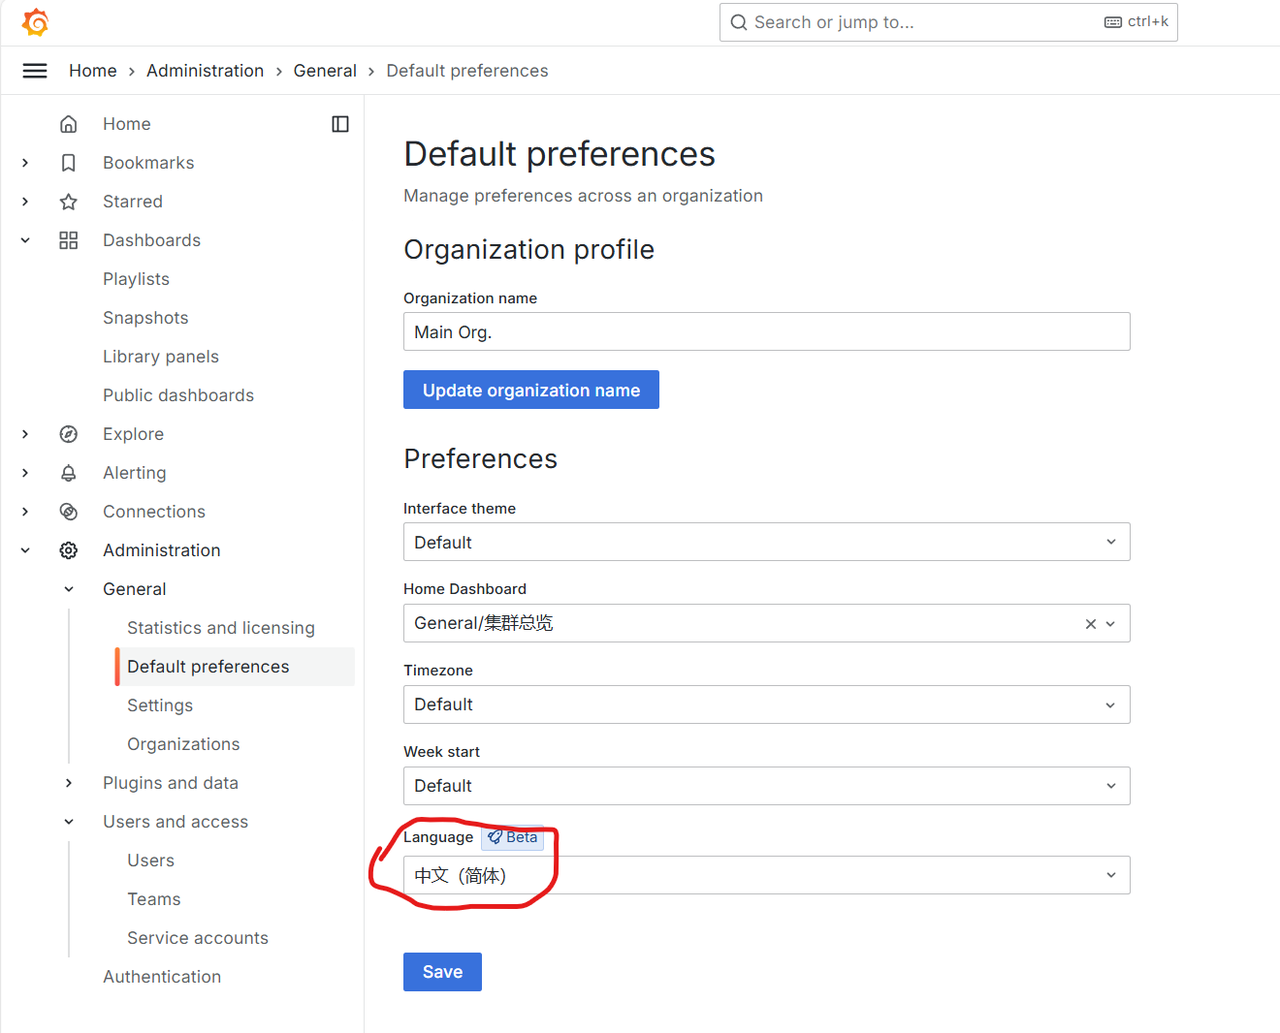
左侧菜单 Administration > General > Default perameters,最后一栏Language,选择“中文”,然后“Save”。确认“Save”。
设置仪表盘主页 在 管理 > 概况 > 默认首选项 中”主页仪表盘”,选择”General/集群总览”。
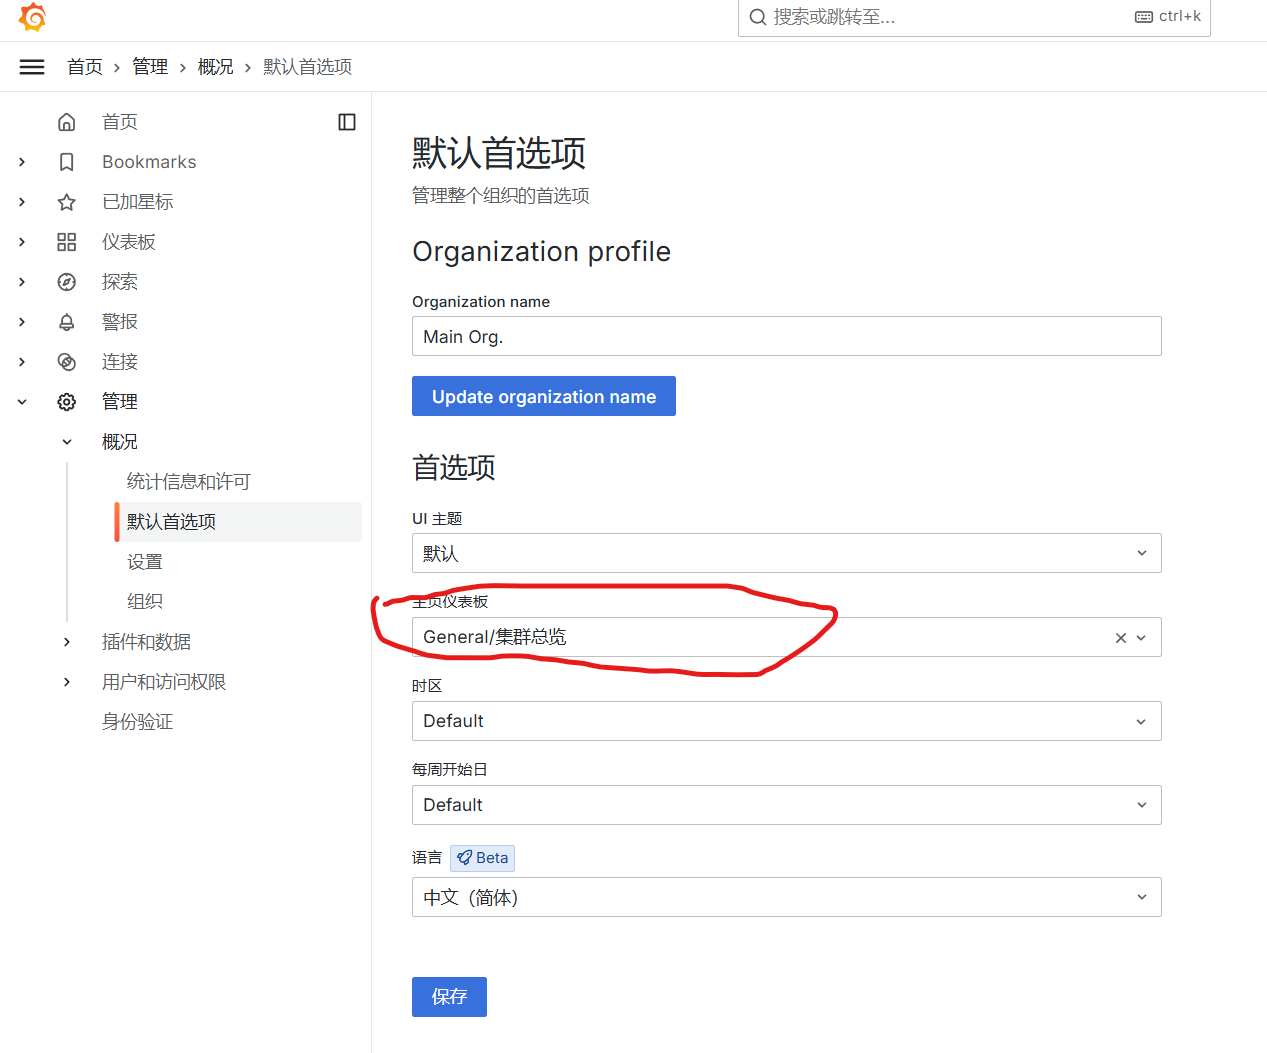
点击“首页”,可以看到集群总览仪表盘。
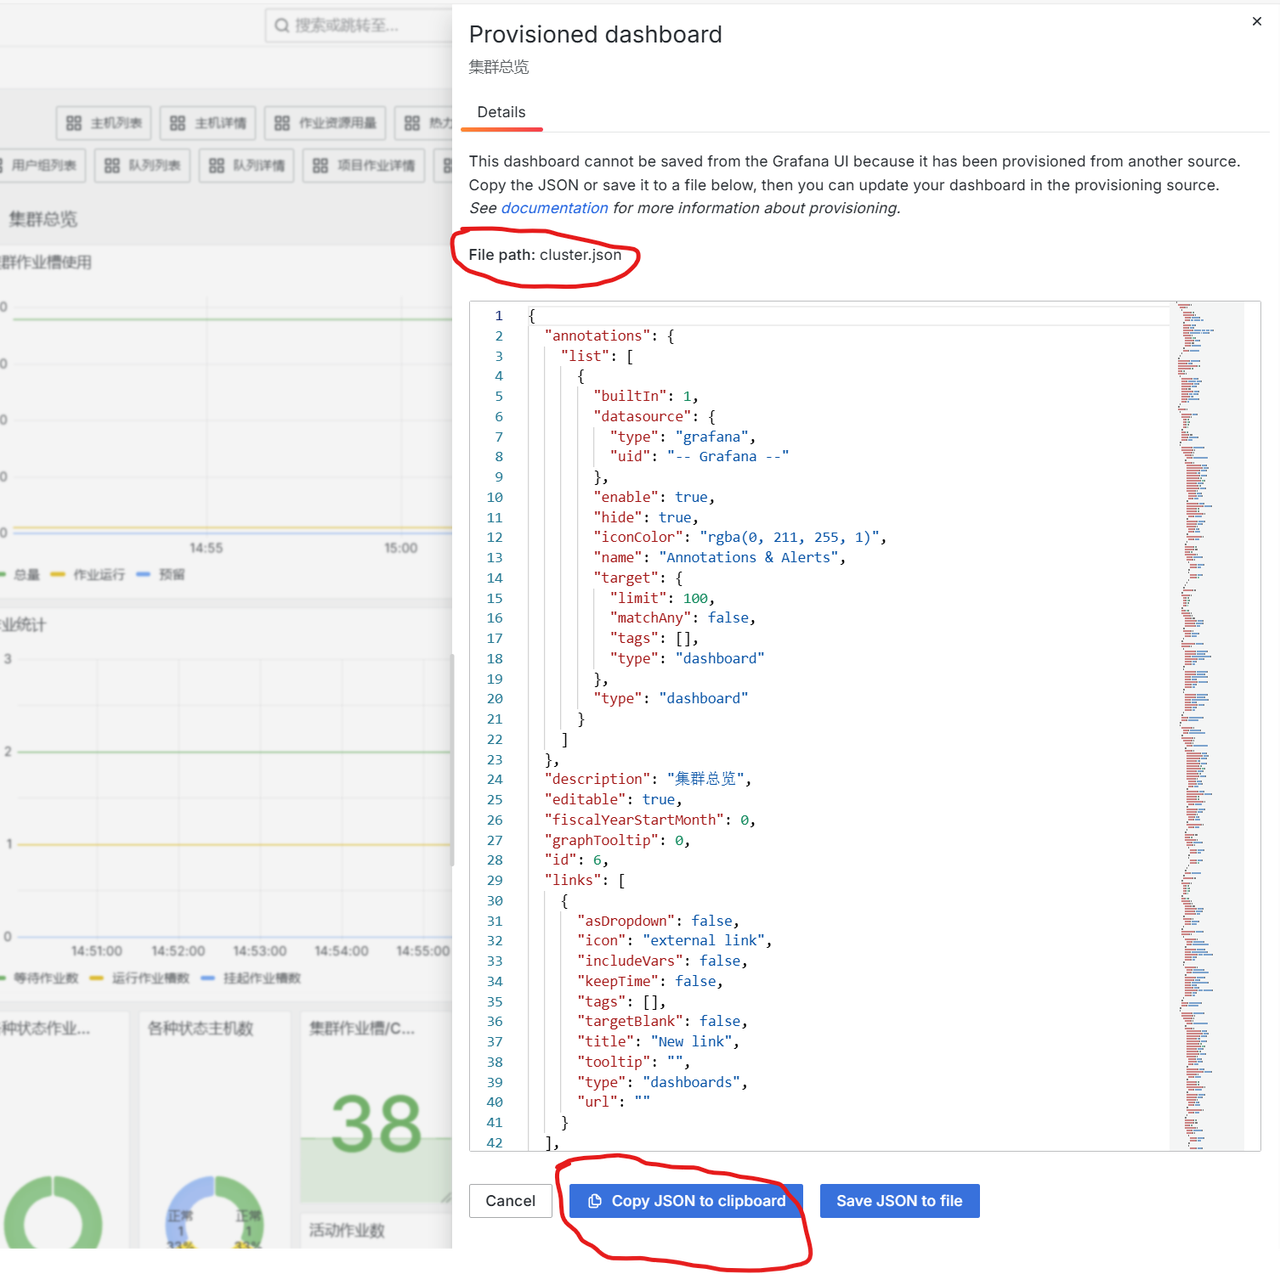
图表的编辑参考Grafana网上的文档。已有的图表修改后不能直接保存,有两个选项:
可以点击右上方 “Save dashboard”右侧的箭头,选择“Save as copy”
点击”Save dashboard”后在弹窗下侧点击Copy JSON to clipboard, 然后把内容覆盖/etc/grafana/provisioning/dashboards/里相应的.json文件, 覆盖后重启grafana-server服务。
应用许可证监控
安装
应用许可证监控是可选项。若需要应用许可证监控,在安装时增加参数–enable-lic-exporter:
./install --enable-lic-exporter
安装脚本会安装并配置一个额外的服务lic-exporter。这个服务利用端口16011给Prometheus提供数据。exporter的可执行文件为/usr/sbin/lic-exporter。
配置
应用许可证监控通过aip命令 aip li i。需要监控应用许可证则需要编写aip命令的许可证配置文件 lic.yaml。 这个文件里定义了需要监控的许可证服务器信息,以便aip命令获取许可证使用数据。
参考 lic.yaml ,配置后用命令 aip li i 检查输出。命令输出例子:
SERVICE  SERVER           FEATURE  EXPIRY  TOTAL  FREE  USER    USE
Skyform  14203@licserver  aip              13     10    cadmin  1
Skyform  14203@licserver  aip              13     10    u001    1
Skyform  14203@licserver  cmp              23     23            0
Skyform  14203@licserver  amp              102    99    cadmin  1
Skyform  14203@licserver  amp              102    99    u001    2
检查
最后检查lic-exporter的指标:
$ curl -s localhost:16011/metrics | grep lsf_lic
# HELP lsf_lic_expiry Feature Expiry Timestamp
# TYPE lsf_lic_expiry gauge
lsf_lic_expiry{feature="aip",server="13006@192.168.10.10",vendor="skyform_lmd"} 1.7749296e+09
lsf_lic_expiry{feature="amp",server="13006@192.168.10.10",vendor="skyform_lmd"} 1.814328e+09
lsf_lic_expiry{feature="cmp",server="13006@192.168.10.10",vendor="skyform_lmd"} 9.223372e+18
# HELP lsf_lic_free Free Licenses
# TYPE lsf_lic_free gauge
lsf_lic_free{feature="aip",server="13006@192.168.10.10",vendor="skyform_lmd"} 10
lsf_lic_free{feature="amp",server="13006@192.168.10.10",vendor="skyform_lmd"} 99
lsf_lic_free{feature="cmp",server="13006@192.168.10.10",vendor="skyform_lmd"} 23
# HELP lsf_lic_total Total Licenses
# TYPE lsf_lic_total gauge
lsf_lic_total{feature="aip",server="13006@192.168.10.10",vendor="skyform_lmd"} 13
lsf_lic_total{feature="amp",server="13006@192.168.10.10",vendor="skyform_lmd"} 102
lsf_lic_total{feature="cmp",server="13006@192.168.10.10",vendor="skyform_lmd"} 23
# HELP lsf_lic_use Licenses in Use
# TYPE lsf_lic_use gauge
lsf_lic_use{feature="aip",user="cadmin"} 1
lsf_lic_use{feature="aip",user="u001"} 1
lsf_lic_use{feature="amp",user="cadmin"} 1
lsf_lic_use{feature="amp",user="u001"} 2
creport统计报表生成
aip-eda-exporter里含有一个cron引擎。配置文件为$LSF_ENVDIR/cron.conf。配置文件的格式与Linux上的crontab一致,即每一行为cron时间配置,空格, 所执行的命令。安装后的配置(如/opt/skyformai/etc/cron.conf)如下:
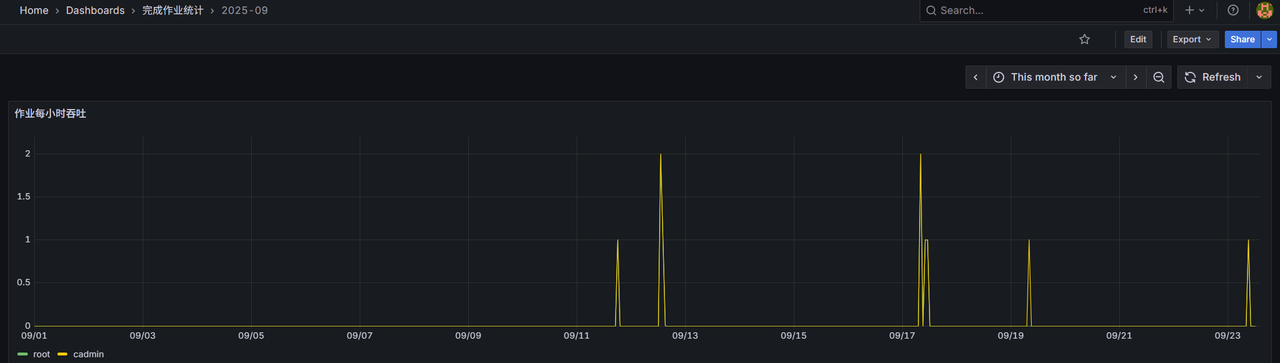
59 23 * * * python3 /usr/sbin/throughput.py /opt/lsf/work/cluster1/aip-eda-exporter
在每天的23:59分运行Python 脚本/usr/sbin/throughput.py 调用creport生成当月的每小时作业吞吐CSV报表。 文件存放在/opt/lsf/work/集群名/aip-eda-exporter里, 每月的文件名为YYYY-MM.job-throughput-user.csv,如2025-09.job-throughput-user.csv。 Python脚本throughput.py同时在Grafana里用admin账号用Grafana API生成响应的dashboard。 dashboard放在dashboard目录“完成作业统计”里,每月一个dashboard。
警告
如果admin账号的密码改了,需要修改/usr/sbin/throughput.py
从Grafana的面板(Panel)数据中输出CSV和PNG图形文件
工具
如果需要从Grafana dashboard的基于Prometheus的某个面板(panel)里抓取数据,输出到一个CSV文件里,以便被Excel读取,可以利用包里的工具 panels2csv.py。 工具在解压包里的grafana/custom目录下。
该工具也可以用于生成面板的PNG图形文件。
警告
这个工具依赖于Python3的pandas包。在线系统可以用命令直接从互联网上拉:
pip3 install pandas
离线环境可以先下载whl文件,然后把文件拷到这个工具运行的主机上安装:
pip3 download pandas          # 会同时下载依赖包
pip3 install *.whl            # 在跑工具的主机上安装下载的包
Python 3.6的pandas的whl文件(EL7/EL8)也已经包含在这个软件的包里 python36-pandas.tar.gz 。
生成图像需要的组件安装
图形利用Grafana的grafana-image-renderer和无头Chromium浏览器配合Grafana生成。
备注
组件安装在运行Grafana的主机上。
安装无头Chromium浏览器
命令:
yum install -y epel-release
yum install -y chromium-headless
或者直接从解压后的本组件安装包里执行:
yum localinstall -y grafana/image-renderer/*.rpm
安装grafana-image-renderer服务
在解压的本组件安装后的目录里,运行命令:
cd grafana/image-renderer
./install-grafana-image-renderer
这个脚本会安装grafana-image-renderer服务,并且试图在/etc/grafana/grafana.ini中添加以下配置内容:
[rendering]
server_url = http://localhost:8081/render
callback_url = http://localhost:3000/
renderer_token = -
如果Grafana的配置文件不是/etc/grafana/grafana.ini,请手动把以上的内容添加到Grafana的配置文件中,然后重启Grafana服务。
检查grafana-image-renderer服务
grafana-image-renderer由systemd管理。可以用system的命令查看:
systemctl status grafana-image-renderer    # 查看服务状态
journalctl -u grafana-image-renderer -e    # 查看grafana-image-renderer的最新日志
配置文件
工具panels2csv.py需要读取一个配置文件,定义输出的具体内容:
./panels2csv.py ./csv.yaml
配置文件的例子和每个参数的解释如下,一个配置文件可以定义输出多个panel的CSV文件,如果输出文件名不定义,则输出到stdout:
grafana_url: http://192.168.10.100:3000                       # Grafana访问URL
# grafana_token: absdffe35fa                                  # 如果Grafana不允许匿名访问,需要在Grafana中生成访问token,配置于此
reports:                                                      # 定义一组report
- dashboard_uid: f1ed5407-6f68-4af2-968d-c8acad049ffd         # dashboard的uid,获得方法见下方说明
  panel_id: 3                                                 # panel的ID,获得方法见下方说明
  from: now-1d                                                # 数据起始时间,可以是Grafana里的相对时间或UNIX毫秒时间戳, 或者本地时间如2025-12-01T12:00:00
  to: now                                                     # 数据终止时间,与from格式相同
  csvfile: aip-aipg-io-DATE.csv                               # 生成的CSV文件名,里面的DATE字串会被运行命令时的“年-月-日”替代
  vars:                                                       # 如果panel里用了变量,需要这些变量的值,否则CSV生成失败
  - name: cluster
    value: aip
  - name: hostname
    value: aipg
- dashboard_uid: f1ed5407-6f68-4af2-968d-c8acad049ffd
  panel_id: 10
  from: now-1d
  to: now
  image:
    file: aip-aipg-slots-DATE.png                                # 生成的PNG图形文件的文件名
    theme: light                                              # 浅色图还是深色图(dark),可选。缺省light
    width: 2048                                               # 图形的横向像素数,可选。缺省2000
    height: 600                                               # 图形的纵向像素数,可选。缺省根据横向按比例缩放
  vars:
  - name: cluster
    value: aip
  - name: hostname
    value: aipg
这个配置例子生成一个CSV文件,一个图形文件,如aip-aipg-io-2025-05-01.csv和aip-aipg-slots-2025-05-01.png。
获得仪表板dashboard uid的方法
在Grafana中访问面板(panel)所在的仪表板(dashboard),点击右上方的“导出”,选择“导出为JSON”。
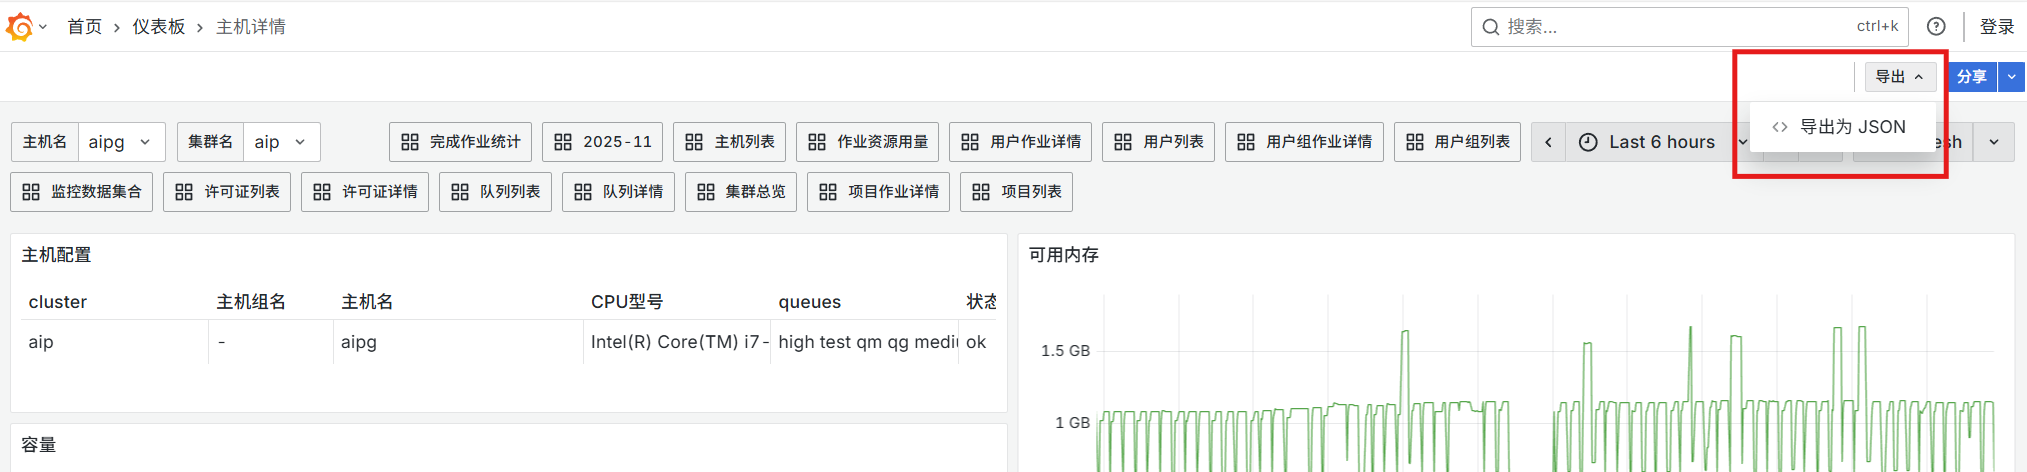
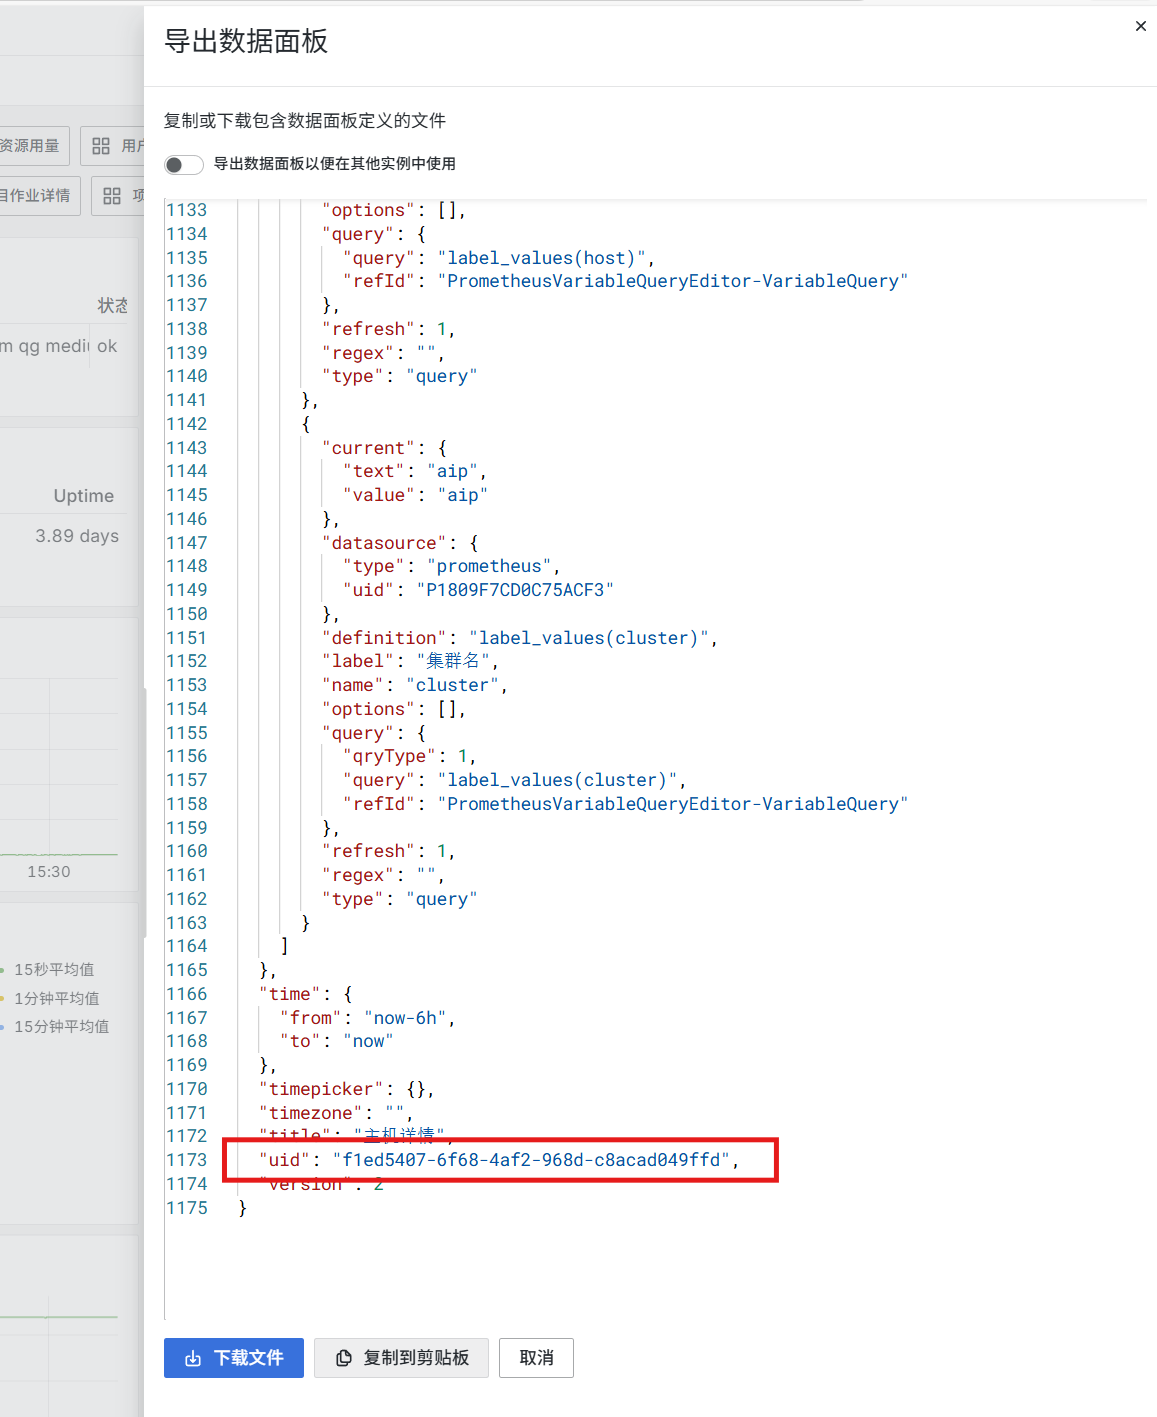
输出的尾部有“uid”的值。
获得面板panel id的方法
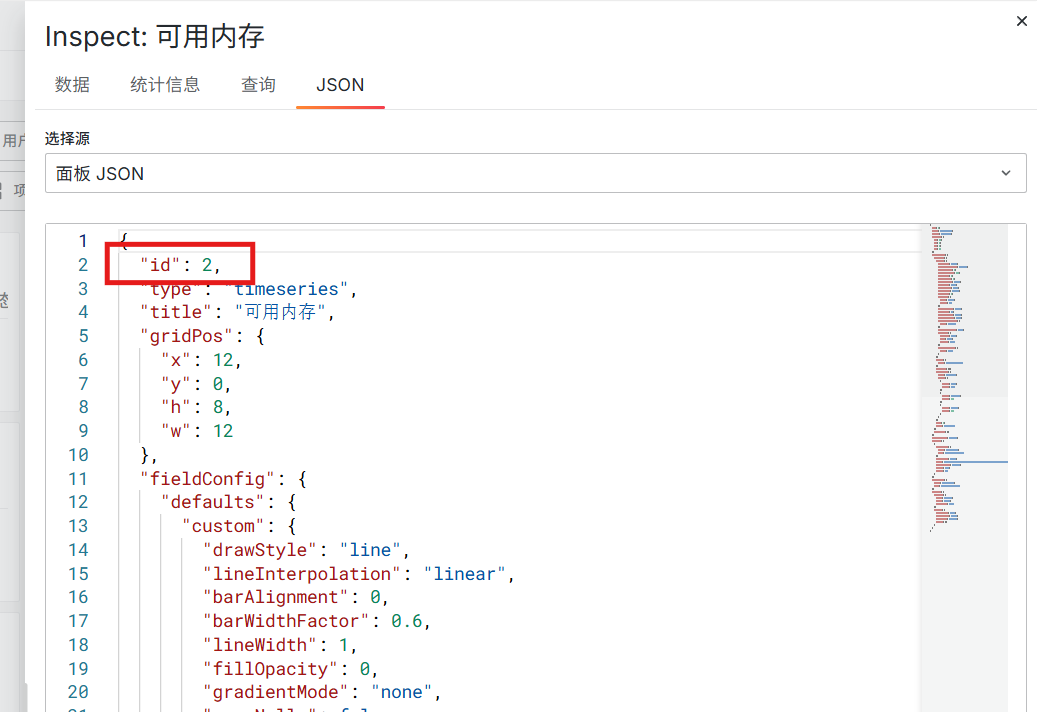
在Grafana中访问panel所在的仪表板(dashboard),点击panel右上角的三个竖点打开菜单,点击“检查”,选择“面板JSON”。
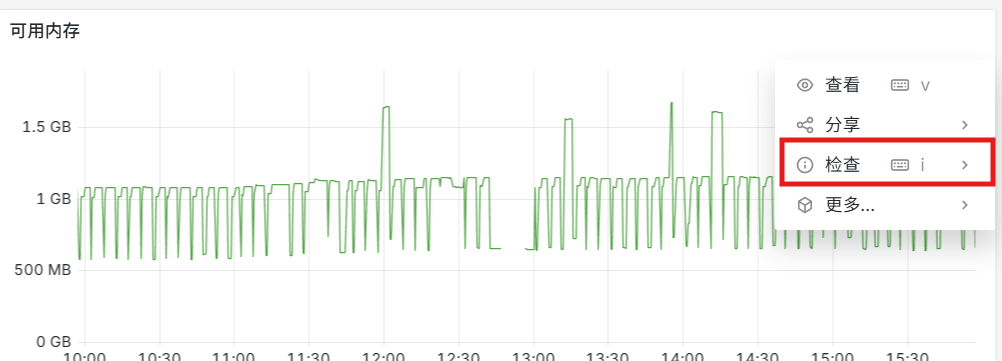
输出的头部有“id”的值。
备注
若需要每天定时生成CSV文件,可以利用aip-eda-exporter里自带的cron工具。详见 creport统计报表生成 。
小技巧
CSV文件里数据的标题使用面板Legend里的值,缺省的Legend是表达式,需要输出CSV的面板里建议修改每个Quary中Legend的值。
可选参数的动态报表生成
aip-eda-exporter的安装包里有一个工具用于生成Grafana的动态仪表版 grafana/custom/custom-view.py。
警告
这个工具不支持LSF集群的监控参数。
这个工具使用命令行参数定义生成的仪表盘里的面板和时间窗。命令行参数为:
- -h | –help
命令参数说明。
- -c | –cluster 集群名
可选。选择生成某个集群的仪表盘,缺省:所有集群。
- -d | –duration 起始时间,终止时间
必选。定义时间窗。语法为Grafana可接受的语法。例子:
now-1d,now
1764430476000,176551687000 # 时间戳毫秒
- -g | –grafana Grafana连接URL
必选。定义Grafana连接方式。格式为:http://用户:密码@IP地址:端口。 由于需要修改Grafana的仪表盘,需要提供可以增删仪表盘的用户名和密码。例子:http://admin:admin@192.168.10.100:3000。
- -m | –host 主机名
可选。选择生成某主机的仪表盘。
- -q | –queue 队列名
可填。选择生成某队列的仪表盘。
- -p | –prometheus Prometheus访问URL
获得Prometheus内集群、队列以及队列所含主机的结构数据,以及可用于面板的指标。这个参数与所有其他参数互斥。 输出例子:
{
  "clusters": [
    {
      "cluster": "aip",
      "queues": [
        {
          "queue": "high",
          "hosts": [
            "aipg",
            "aipm",
            "centos6",
            "node111",
            "u22",
            "w19"
          ]
        },
        {
          "queue": "test",
          "hosts": [
            "aipg",
            "u22"
          ]
        },
        {
          "queue": "qm",
          "hosts": [
            "aipg",
            "aipm"
          ]
        }
      ]
    }
  ],
  "metrics": [
    "cpuut",
    "iokbps",
    "memgb",
    "slots",
    "cpurq",
    "tmpgb",
    "memut",
    "slotut"
  ]
}
- 指标
必选。定义一个或多个面板指标,多个指标用逗号隔开。多个指标或生成多个面板。指标为:
cpurq:CPU进程队列平均值,有15秒,1分,和15分三个指标在一个面板里。
cpuut:CPU平均利用率,单位为%。
iokbps:IO单位为kbps。
memgb:最大可用总内存和已用总内存,单位为GB。
memut:内存利用率,单位为%。
slots:最大作业槽数和已用作业槽数。
slotut:作业槽(CPU核占用率)利用率,单位为%。
tmpgb:主机/tmp最大空间和已用空间总和,单位为GB。
- 命令输出
生成的Grafana仪表板访问URL。
警告
生成的仪表板的名字为“可选参数报表”。请不要修改这个名字。
例子,生成集群aip中队列medium在过去24小时的slotut和cpuut:
./custom-view.py -d now-24h,now -g http://admin:admin@192.168.10.100:3000 -c aip -q medium slotut,cpuut

http://192.168.10.100:3000/d/6df63e2f-fa89-4479-bce7-22b5e435eaf7/e58faf-e98089-e58f82-e695b0-e68aa5-e8a1a8?kiosk&from=now-24h&to=now
例子中的输出是仪表板的访问URL。
高可用方案(独立部署)
高可用的方案是:
把Prometheus、Grafana、和aip eda exporter在每个master节点上部署一套
把Prometheus的数据库放到共享存储上:
mv /usr/lib/prometheus /share/prometheus
删除本地文件 rm -fr /usr/lib/prometheus,然后在每个master上建立symlink:ln -s /share/prometheus /usr/lib/prometheus
修改每台机器上的/lib/systemd/system/prometheus.service:
[Unit]
Description=Prometheus
[Service]
WorkingDirectory=/usr/lib/prometheus
ExecStart=/usr/lib/prometheus/prometheus.sh
Restart=always
RestartSec=15
[Install]
WantedBy=multi-user.target
重启每台master主机上的prometheus服务:
systemctl daemon-reload; systemctl restart prometheus
prometheus.sh脚本定期检测本机是否为AIP master,如果不是,杀死prometheus进程,循环等待, 这样保证任何时候只有一个prometheus进程从AIP获取数据,放到共享的Prometheus数据库里。
高可用方案(与SkyForm集群管理集成)
把exporter安装在集群的两台master上,同一时间只有主master上的exporter有数据:
./install --exporter-only --master-only
配置Prometheus同时从两台master上的exporter中采集数据,Prometheus.yml的例子:
scrape_configs:
- job_name: "aip_eda_exporter"
  scrape_interval: 30s
  scrape_timeout: 25s
  static_configs:
  - targets: ["192.168.10.100:16010"]            # master 1
- job_name: "lic_expoter"
  scape_interval: 60s
  scrape_timeout: 50s
  static_configs:
  - targets: ["192.168.10.100:16011"]            # master 1
- job_name: "aip_eda_exporter1"
  scrape_interval: 30s
  scrape_timeout: 25s
  static_configs:
  - targets: ["192.168.10.101:16010"]            # master 2
- job_name: "lic_expoter1"
  scape_interval: 60s
  scrape_timeout: 50s
  static_configs:
  - targets: ["192.168.10.101:16011"]            # master 2
采集的数据指标
可以通过运行以下命令获取aip-eda-exporter的输出指标:
curl localhost:16010/metrics | grep lsf_
备注
每个指标都有cluster标签,cluster的值是配置在$LSF_ENVDIR/aip-exporter.yaml里的, 例子:cluster: aip
集群
指标:
lsf_cluster_maxslots: 集群总作业槽数
lsf_cluster_nclosed: 集群关闭的作业槽数
lsf_cluster_nresv: 集群保留的作业槽数
lsf_cluster_nrun: 集群运行的作业槽数
lsf_cluster_nunavail: 集群不可用作业槽数
lsf_cluster_nused: 集群已用作业槽数
lsf_cluster_maxmemgb: 集群最大内存GB
lsf_cluster_usedmemgb: 集群已用内存GB
lsf_cluster_ut: 集群权重CPU利用率%
lsf_cluster_maxgpus: 集群总GPU数
lsf_cluster_usedgpus: 集群被使用的GPU数
lsf_cluster_gut: 集群GPU利用率(0-100)
lsf_cluster_gmut: 集群GPU显存利用率(0-100)
作业数
指标:
lsf_job_pjobs: 集群等待作业数,标签:
preason: 作业等待原因
lsf_job_runjobs: 集群作业运行数
lsf_job_suspjobs: 集群作业挂起数
主机
备注
主机指标都带有以下标签:
hgroups: 主机所属主机组(可多个)
queues: 主机所属主机队列(可多个, 只支持AIP)
host: 主机名
model: 主机CPU型号
status: 主机状态 (参考 chosts 输出)
ugroups: 可用这个主机的用户组(可多个,只支持AIP)
指标:
lsf_host_cpuut: 主机CPU利用率%
lsf_host_ncpus: 主机CPU核数
lsf_host_iokbps 主机网络IO kb/s
lsf_host_maxmemgb: 主机安装的内存GB
lsf_host_maxslots: 主机最大作业槽数
lsf_host_maxswapgb: 主机配置的交换区GB
lsf_host_maxtmpgb: 主机/tmp最大空间GB
lsf_host_nresv: 主机预留作业槽数
lsf_host_nrun: 主机运行作业槽数
lsf_host_nused: 主机已用作业槽数
lsf_host_pg: 主机操作系统分页率
lsf_host_r15m: 主机OS进程队列15分钟平均值
lsf_host_r15s: 主机OS进程队列15秒钟平均值
lsf_host_r1m: 主机OS进程队列1分钟平均值
lsf_host_uptime: 主机开机后的时间(分钟)(只支持AIP)
lsf_host_usedmemgb: 主机已用内存GB
lsf_host_usedswapgb: 主机已用交换区GB
lsf_host_usedtmpgb: 主机已用/tmp存储GB
lsf_host_usedtmpgb: 主机已用/tmp存储GB
lsf_host_maxgpus: 主机总GPU数
lsf_host_usedgpus: 主机被使用的GPU数
lsf_host_gut: 主机GPU利用率(0-100)
lsf_host_gmut: 主机GPU显存利用率(0-100)
运行的作业(可选)
备注
运行的作业指标都带有以下标签:
jobid:作业号
nslots:作业槽数
user:作业用户
这些指标由aip-exporter.yaml里的max_run_jobs控制。见本章上面的描述。
指标:
lsf_job_cpusec: 作业CPU使用时间(秒)
lsf_job_cpuut: 作业当前CPU利用率%
lsf_job_memgb: 作业当前内存使用GB
lsf_job_iokbps: 作业当前文件IO kb/s
lsf_job_nthreads: 作业当前线程数
lsf_job_swapgb: 作业虚存使用GB
lsf_job_runtime: 作业运行时长(秒)
lsf_job_reqmemgb: 作业请求内存预留(GB)
lsf_job_usedgpus: 作业使用的GPU数
lsf_job_gut: 作业GPU利用率(0-100)
lsf_job_gmut: 作业GPU显存利用率(0-100)
lsf_job_memeff: 作业实际使用内存 / 作业请求的内存,若没有请求内存,则为0
队列
指标:
lsf_queue_maxslots: 队列最大可用作业槽数
lsf_queue_npend: 队列等待作业槽数
lsf_queue_nrun: 队列运行作业槽数
lsf_queue_nsusp: 队列挂起作业槽数
lsf_queue_pjobs: 队列等待作业数
lsf_queue_usedslots: 队列已用作业槽数
lsf_queue_maxmemgb: 队列最大可用内存GB(只支持AIP)
lsf_queue_usedmemgb: 队列已用内存GB(只支持AIP)
lsf_queue_ut: 队列权重CPU利用率%(只支持AIP)
lsf_queue_maxgpus: 队列总GPU数
lsf_queue_usedgpus: 队列被使用的GPU数
lsf_queue_gut: 队列GPU利用率(0-100)
lsf_queue_gmut: 队列GPU显存利用率(0-100)
共享资源
备注
共享资源指标都带有以下标签:
resource: 共享资源名
指标:
lsf_shared_res_value: 共享资源总数
lsf_shared_res_used: 共享资源已用数
共享文件系统
共享文件系统指标由自动检测NFS和GPFS挂载获得。
指标:
lsf_sharedfs_max: 共享文件系统总容量GB,标签:share - 挂在目录
lsf_sharedfs_used: 共享文件系统已用容量GB,标签:share - 挂在目录
调度用户组
指标:
lsf_ugroup_npend:组等待作业槽数,标签:
ugroup: 组名
preason: 作业等待原因
lsf_ugroup_nrun: 组运行作业槽数,标签ugroup: 组名
lsf_ugroup_nsusp: 组挂起作业槽数,标签ugroup: 组名
lsf_ugroup_ut: 用户组所有运行和挂起作业的每核平均CPU利用率,值为百分数,即0-100,若有作业超用CPU核的,只可能超过100,标签ugroup: 组名
lsf_ugroup_avgmemgb: 用户组所有运行和挂起作业的平均内存使用GB,标签ugroup: 组名
lsf_ugroup_usedgpus: 用户组使用的GPU数,标签ugroup: 组名
lsf_ugroup_gut: 用户组GPU利用率(0-100),标签ugroup: 组名
lsf_ugroup_gmut: 用户组GPU显存利用率(0-100),标签ugroup: 组名
用户
指标:
lsf_user_npend:用户等待作业槽数,标签:
user:用户名
preason:作业等待原因
lsf_user_nrun:用户运行作业槽数,标签user:用户名
lsf_user_nsusp:用户挂起作业槽数,标签user:用户名
lsf_user_ut: 用户所有运行和挂起作业的每核平均CPU利用率,值为百分数,即0-100,若有作业超用CPU核的,只可能超过100,标签user:用户名
lsf_user_avgmemgb: 用户所有运行和挂起作业的平均内存使用GB,标签user:用户名
lsf_user_usedgpus: 用户使用的GPU数,标签user:用户名
lsf_user_gut: 用户GPU利用率(0-100),标签user:用户名
lsf_user_gmut: 用户GPU显存利用率(0-100),标签user:用户名
项目
指标:
lsf_proj_npend: 项目等待作业槽数,标签:
project:项目名
preason:作业等待原因
lsf_proj_nrun:项目运行作业槽数,标签project:项目名
lsf_proj_nsusp:项目挂起作业槽数,标签project:项目名
lsf_proj_ut: 项目所有运行和挂起作业的每核平均CPU利用率,值为百分数,即0-100,若有作业超用CPU核的,只可能超过100,标签project:项目名
lsf_proj_avgmemgb: 项目所有运行和挂起作业的平均内存使用GB,标签project:项目名
lsf_proj_usedgpus: 项目使用的GPU数,标签project:项目名
lsf_proj_gut: 项目GPU利用率(0-100),标签project:项目名
lsf_proj_gmut: 项目GPU显存利用率(0-100),标签project:项目名
主机组
指标:
lsf_hgroup_maxslots: 主机组最大可用作业槽,标签 hgroups: 组名
lsf_hgroup_usedslots: 主机组已用作业槽,标签 hgroups: 组名
lsf_hgroup_maxmemgb: 主机组最大可用内存GB,标签 hgroups: 组名
lsf_hgroup_usedmemgb: 主机组已用内存GB,标签 hgroups: 组名
lsf_hgroup_ut: 主机组权重CPU利用率%,标签 hgroups: 组名
lsf_hgroup_maxgpus: 主机组总GPU数,标签 hgroups: 组名
lsf_hgroup_gut: 主机组GPU利用率(0-100),标签 hgroups: 组名
lsf_hgroup_gmut: 主机组GPU显存利用率(0-100),标签 hgroups: 组名
应用许可证
数据指标没有cluster标签,因为许可证是跨集群的。
指标:
lsf_lic_total:Feature的总许可数,标签:
feature:Feature名
vendor:lic.yaml里配置的services: name,用于识别厂商
vendor_daemon:厂商daemon名
server:许可证服务器(端口@主机)
lsf_lic_free:Feature的可用数,标签:
feature:Feature名
vendor:lic.yaml里配置的services: name,用于识别厂商
vendor_daemon:厂商daemon名
server:许可证服务器(端口@主机)
lsf_lic_use:Feature的被使用数,标签:
feature:Feature名
user:用户名
lsf_lic_expiry:Feature有效到期时间戳,标签:
feature:Feature名
vendor:lic.yaml里配置的services: name,用于识别厂商
vendor_daemon:厂商daemon名
server:许可证服务器(端口@主机)
排错
aip-eda-exporter没有输出,怎样排查?
当运行curl localhost:16010/metrics 没有输出时,首先运行AIP命令lsid查看AIP的key文件是否有效。然后查看以下AIP命令是否正常(aip-eda-exporter调用这些aip命令):
bhosts -w -o "host_name status max njobs run ssusp ususp rsv hgroups queues delimiter='|'" -noheader
lsload -o "HOST_NAME status ut r15s r1m r15m io tmp mem swp pg up delimiter='|'"
bhosts -s -noheader
cjobs -u all -o "id stat user ugroup queue app run_time nalloc_slot name description proj group pend_reason cpu_used ut mem swap io nthread reqmem delimiter='|'" -noheader
bqueues -o "queue priority status maxj ulj jlp jlh numjobs numpend numrun numssusp numususp numreserve pjobs maxavail_slots"
aip-eda-exporter的日志文件在哪里?
aip-eda-exporter服务的日志由systemd管理,可以用systemd的命令查看:
journalctl -u aip-eda-exporter -e # -u指明aip-eda-export -e参数指明只输出最后的日志部分
Prometheus里部分指标有,部分指标没有,怎样排查?
lsf_job, lsf_user, lsf_proj, lsf_ugroup等指标与作业挂钩。集群里没有作业时,这些指标都没有。当集群里有作业时,这些指标会自动出现。